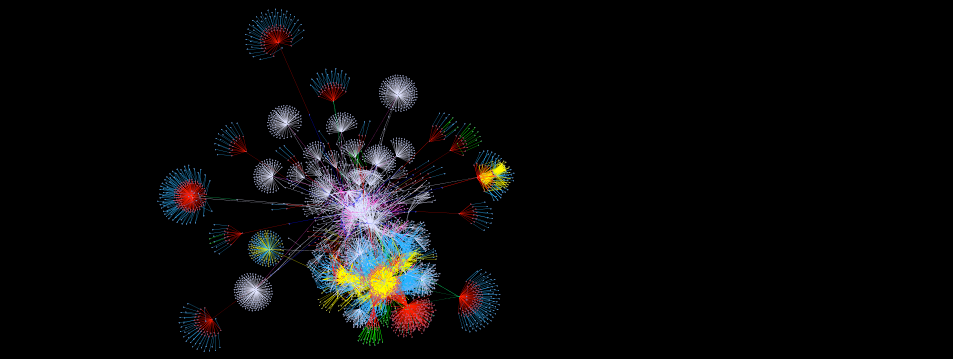
Understand your Build!Try MAKAO!Visualize the build dependency graph to understand how those hundreds of GNU Makefiles
connect to each other. Zoom and drag your way to static libraries, executables or any other build
artifact.
Filter out Junk!Try
MAKAO!Show or hide unimportant build targets and dependencies, like header files, or focus only on GNU Make's dependency graph construction phase, or the actual compilation phase. MAKAO even detects potentially missing dependencies!
Want to Replay your Build?Try
MAKAO!Just use MAKAO's time slider and see your build as it happened! You can even replay the whole build automatically!
Fancy Writing Custom Analyses?Try MAKAO!We
got you covered! Write Python-based scripts to automatically analyze and manipulate the build dependency graph,
or even extend MAKAO!
Oh, you want Declarative Control?Try MAKAO!Why
not let MAKAO generate a Prolog representation of the build dependency graph for you? Then analyze the build to
your declarative heart's content!
[April 28, 2014] MAKAO 1.8 released, with user-friendly UI, time slider,
filtering, GNU Make 4.0 support, identification of gcc/g++ preprocessor flags, and many fixed parser
bugs.
[March 7, 2014] MAKAO 1.7 released, fixing bugs in implicit dependency detection, circular
dependency detection (currently flagged when generating the gdf, but ignored in the graph) and with
weird target names (containing spaces or plus signs).
querying of build targets and dependencies for their build commands and variables
filtering of the build dependency graph using Prolog rules to reduce clutter or to identify build
idioms
verification of the presence of bad smells in the build dependency graph
MAKAO builds on GUESS (Graph Exploration System), which is a
flexible and scriptable graph manipulation framework. It takes the build trace of a GNU Make or ClearMake build run as input,
generates and lays out the build dependency graph, and then provides the above five features to the user.
More information can be found in the tutorial and publications
sections.
PS: Apparently, MAKAO (or Mau-Mau) is the
name of a popular Polish card game, but we intended the name to be an allusion on both the "Made in
Macao"-statement found on products fabricated in Macao and on GNU Make of course.
The latest version of MAKAO can be downloaded here. MAKAO is covered by the
Mozilla Public License 1.1 (MPL 1.1), and runs on Linux, Max OSX and Windows (using Cygwin 1.7.x).
Install the required dependencies listed above, then install the latest version under $MAKAO. Also make sure that
$JAVA_HOME/bin/java refers to your Java 6 or earlier Java runtime.
1. Preparing your Makefiles
1
2
3
all:
   $(MAKE) -C sub1/ all
   make -C sub2/ all
MAKAO needs to trace the full build dependency graph, even across recursive make calls. For this reason, all
such calls should use a variable like $(MAKE) to refer to the make program. If
not, MAKAO will not be able to identify the dependencies in the corresponding recursive build (more on this
here).
You can use the following tool to help you spot potential occurrences of make (NOTE: most of the
results will be false alarm, but better be safe than sorry):
1
2
cd /dir/with/source/code
$MAKAO/parsing/bin/search_for_sub_make.sh path_to_system_to_analyze
If you find an incorrect call to make, please replace it by a call to $(MAKE).
2. Extracting the Build Dependency Graph
1
2
3
4
cd /dir/with/source/code
$MAKAO/parsing/bin/makewrapper.sh all 2&> trace.txt
$MAKAO/parsing/bin/generate_makao_graph.pl -in trace.txt -out trace.gdf \-format gdf
The above commands first run your build system with a bunch of standard GNU Make debugging switches. The
corresponding textual trace (trace.txt) then is analyzed to extract the build dependency graph
used during the build. Note that all is the build target for which one wanted to analyze the
build. You'll notice that an XML file named trace.gdf.xml has also been generated. This one
contains the formal/actual commands executed for each exercised build target, as well as the active
preprocessor flags.
3. Lay Out your Graph using the Force
If you would visualize the generated build dependency graph as is, you would only see one big blob. So, one
needs to lay out the graph with a force-directed layout. For this, type the following:
1
$MAKAO/ui/bin/show.sh trace.gdf -p
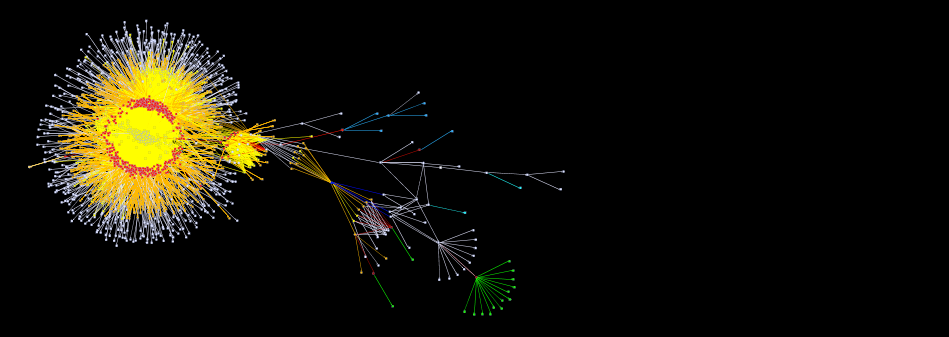
A Java 6 program called GUESS fires up, showing a big blob
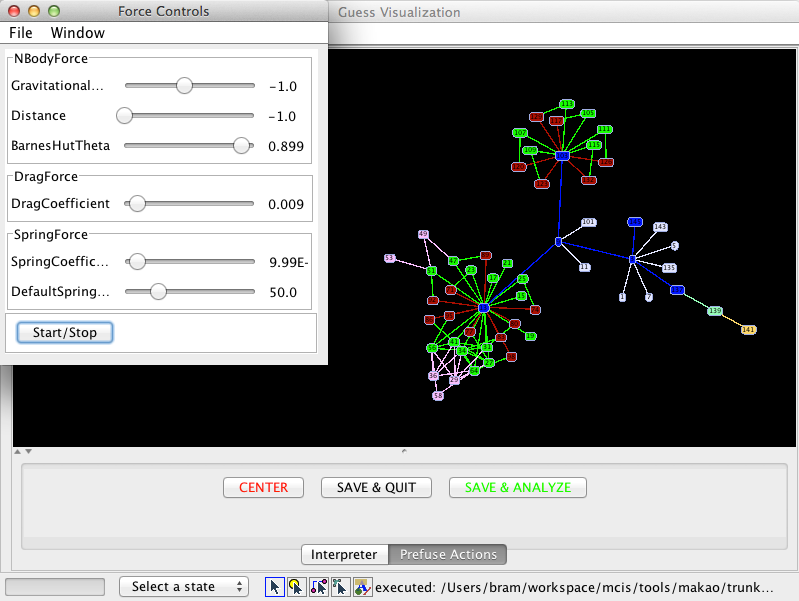
(as predicted) and a separate control panel. Click on the red "CENTER" button to center the graph, then
click on the "Start/Stop" button of the control panel. The blob starts to explode, and you will notice that
small clusters are being pushed outwards. Slowly, but surely you will start to see a structure in the graph.
To help the layout algorithm, it helps to slowly increase the "DefaultSpring..." slider (which increases the
forces between nodes) until it reaches the maximum value.
Once you are happy with the layout, click again on the "Start/Stop" button, then either click on "SAVE &
QUIT" to save the layout and exit, or on "SAVE & ANALYZE" to save the layout and start the analysis of the
graph. The latter will close GUESS and reopen the graph with
the new layout again in the analysis mode.
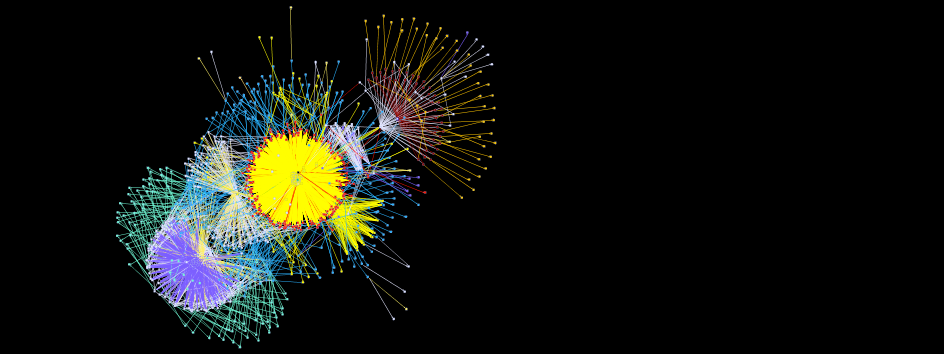
4. Exploring the Build Dependency Graph
You can explore a build dependency graph with layout either after doing the layout (see previous step) or by
executing the following command (the layout algorithm typically adds the "-piccolo" suffix to the .gdf
file):
1
$MAKAO/ui/bin/show.sh trace-piccolo.gdf
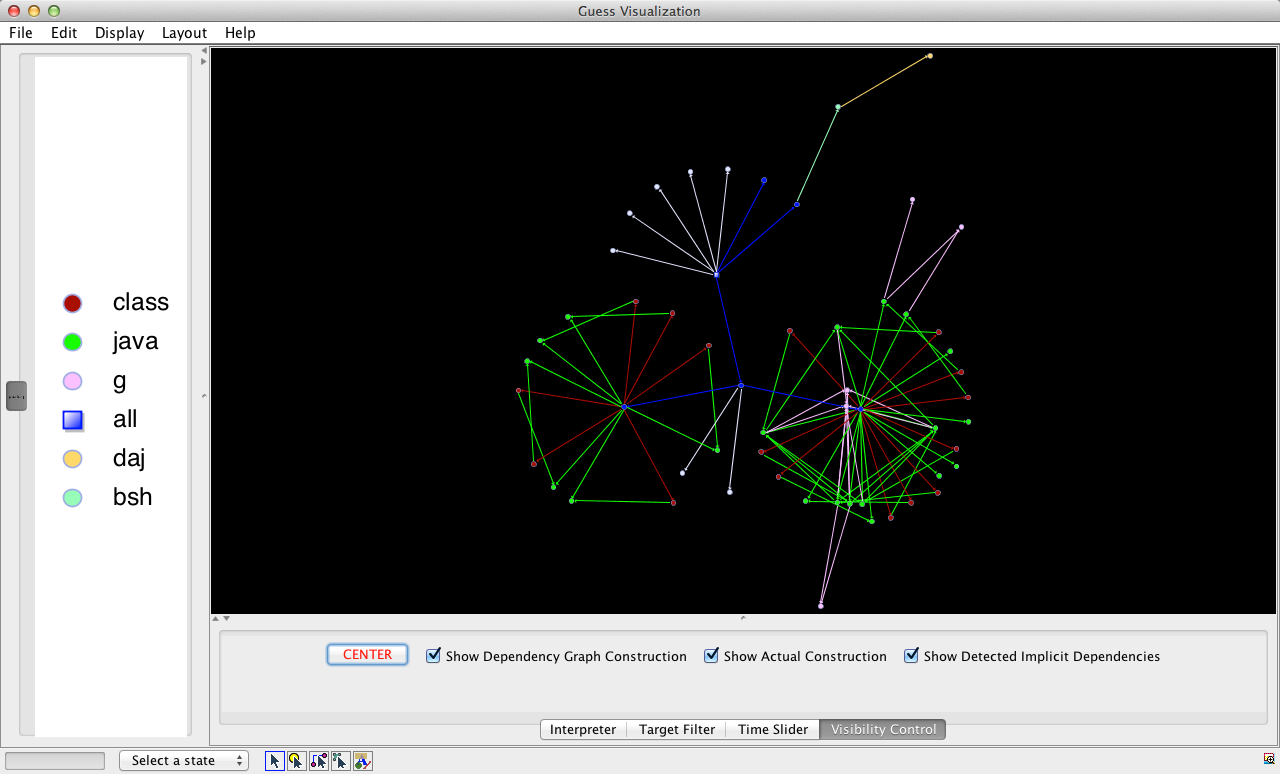
You should now see an attractive build dependency graph in the main window, with on the left a legend
explaining the graph's colors. Basically, each node represents a GNU Make target that was exercised during
the build of your system. Edges represent build dependencies followed during the executed build, with the
top target (e.g., "all") depending on its dependencies, etc. A dependency is colored based on the color of
its destination node (target), and a node's color is based on the corresponding file's extension (red for
.o, blue for .c, etc.). Grey files are files with unknown or system-specific extensions.
You can zoom in or out by holding down the right mouse button and moving to the right/left, respectively.
Drag and hold the left mouse button to pan the dependency graph. Clicking on an edge or node centers and
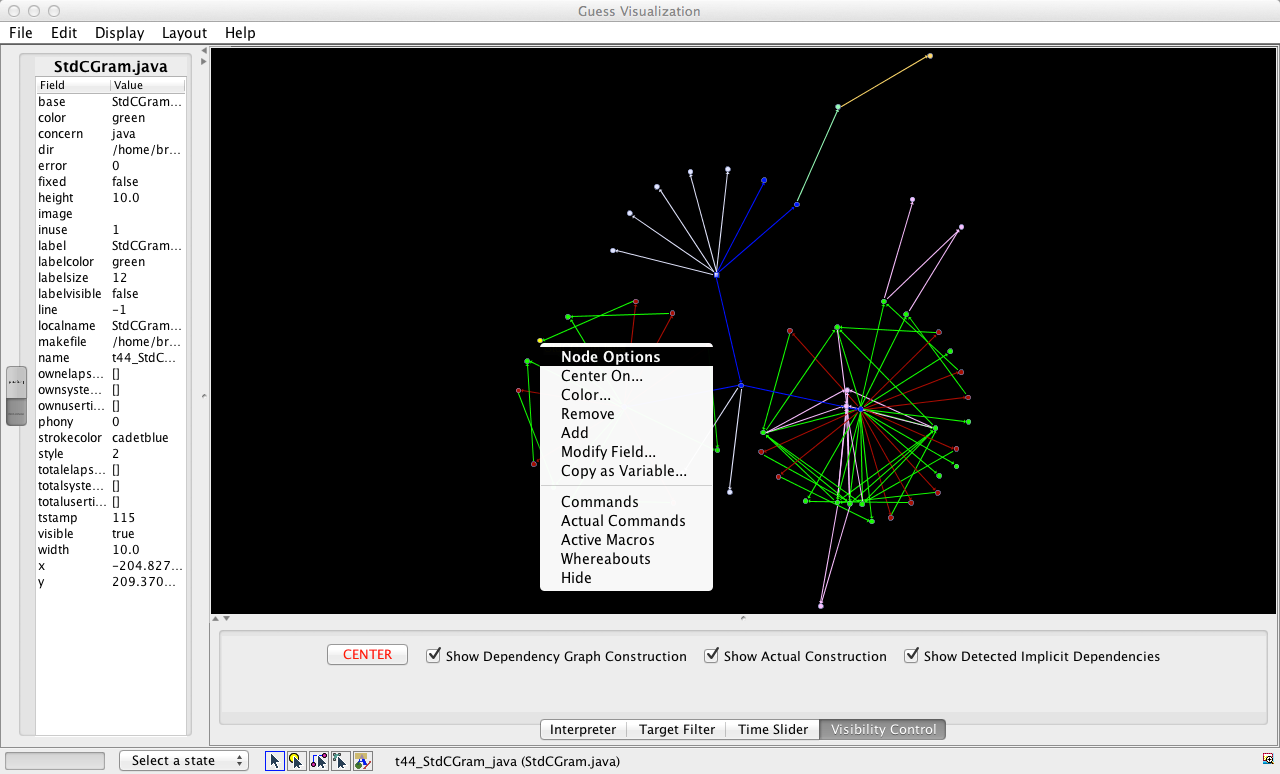
zooms on that edge or node. Choose "Display => Information Window" to see a tab page on the left containing
the values of the nodes' and edges' attributes (depending on the node or edge below the mouse cursor). These
attributes contain information extracted from the build, such as directory names, error status and phony
status for nodes or whether a build dependency is implicit, recursive, pruned or executed during the build
dependency graph construction or execution phase of GNU Make ("ismeta" true/false, resp.).
Even more information can be found when right-clicking on a node or edge. The status menu allow you to assign
a name to the selected node or edge for manipulation in scripts ("Copy as Variable...", see below), see a
target's build recipe as seen in the Makefile ("Commands") or during execution (with Make variables
expanded, "Actual Commands"), get a list of active macro flags ("Active Macros"), or see in which makefile
or directory a build target originated ("Whereabouts").
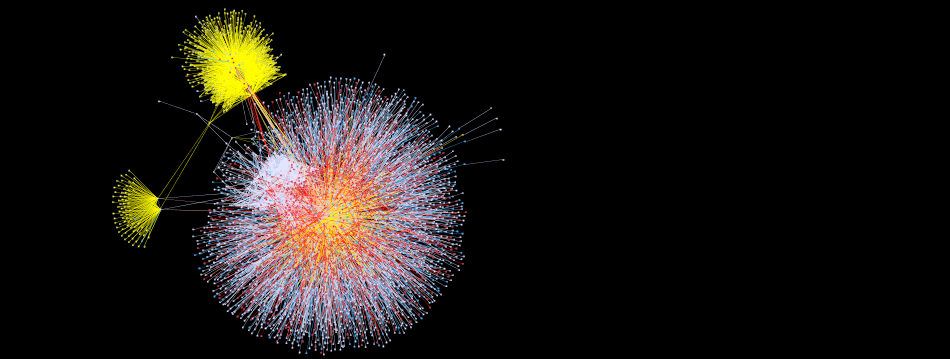
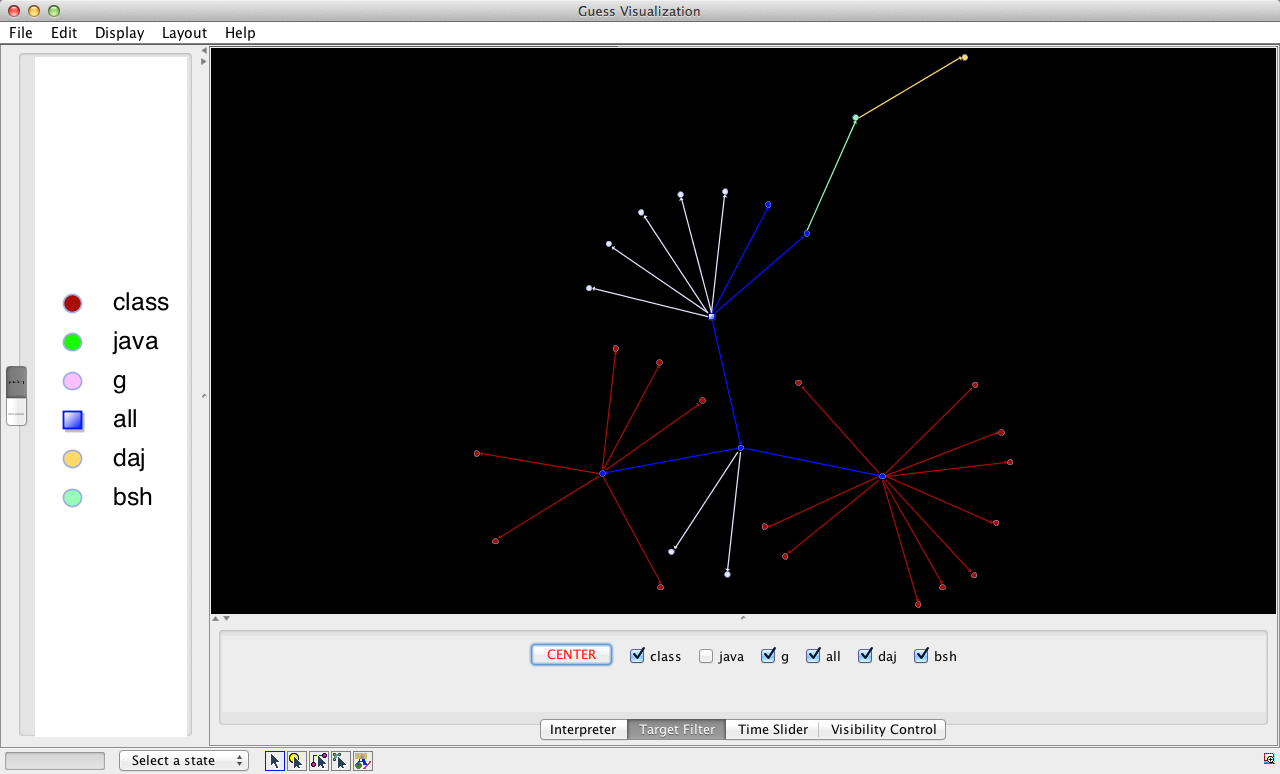
5. Hiding/Showing Unimportant Parts of the Graph
Granted, even after layout, some build dependency graphs still look busy. On the "Target Filter" tab, you can
show/hide targets of any non-grey color. You can then zoom in or drag some nodes around (for this, select
the "Manipulate Nodes" icon on the bottom of the GUESS
window, i.e., the second from left out of five small icons).
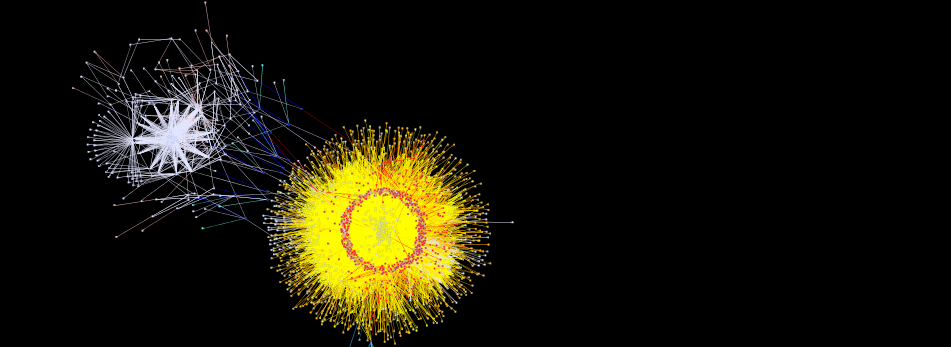
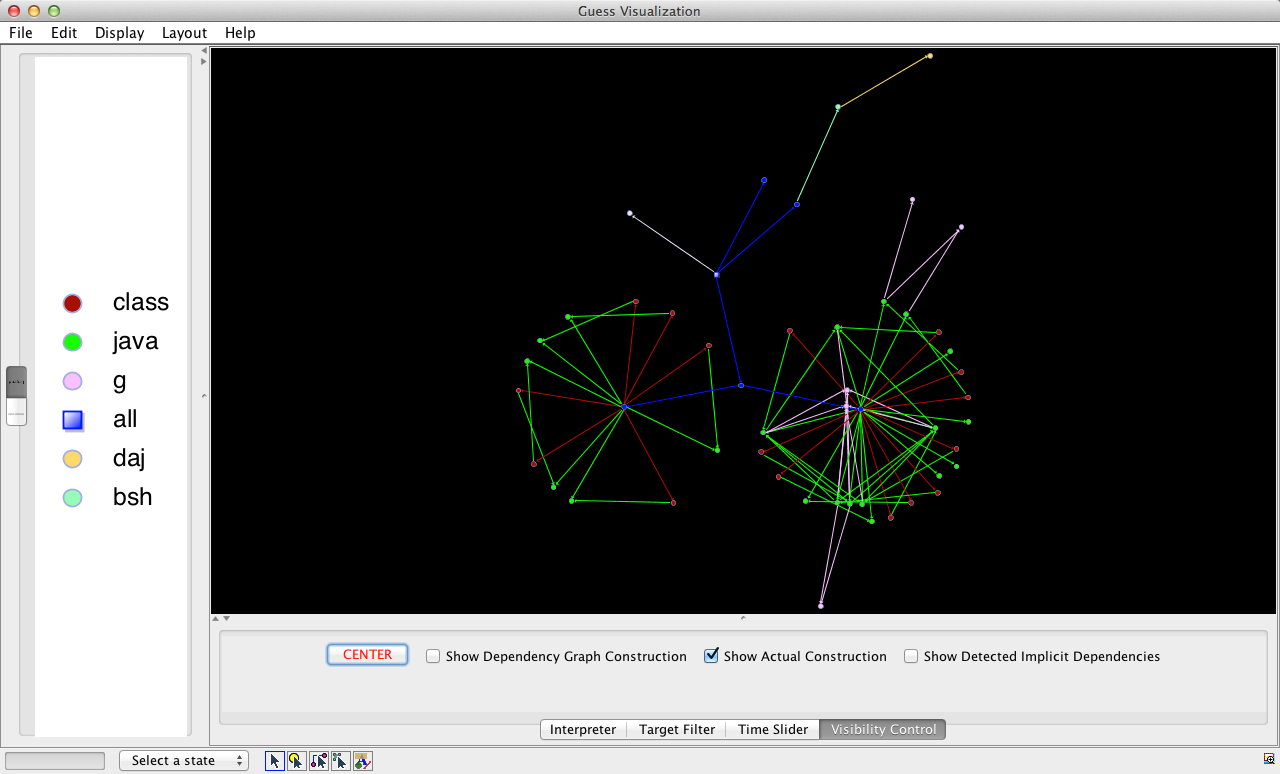
The "Visibility Control" tab allows coarser-grained filtering of the graph. One can use it to show/hide all
targets/dependencies used only in the first phase of GNU Make, i.e., in which GNU Make reads in the
makefiles to build its internal build dependency graph. These are the edges with the "ismeta" attribute set
to true. Similarly, one can also show/hide the targets/dependencies used only during the actual construction
phase, where the real compilation and processing of source code files happens.
Finally, MAKAO is able to scan the build commands executed for each build target to identify files that are
not mentioned as build dependencies in the corresponding Makefile rule. Such omissions could be errors in
the Makefile, or could be false alarm. In the latter case, you can hide those dependencies with the third
control on the "Visibility Control" tab.
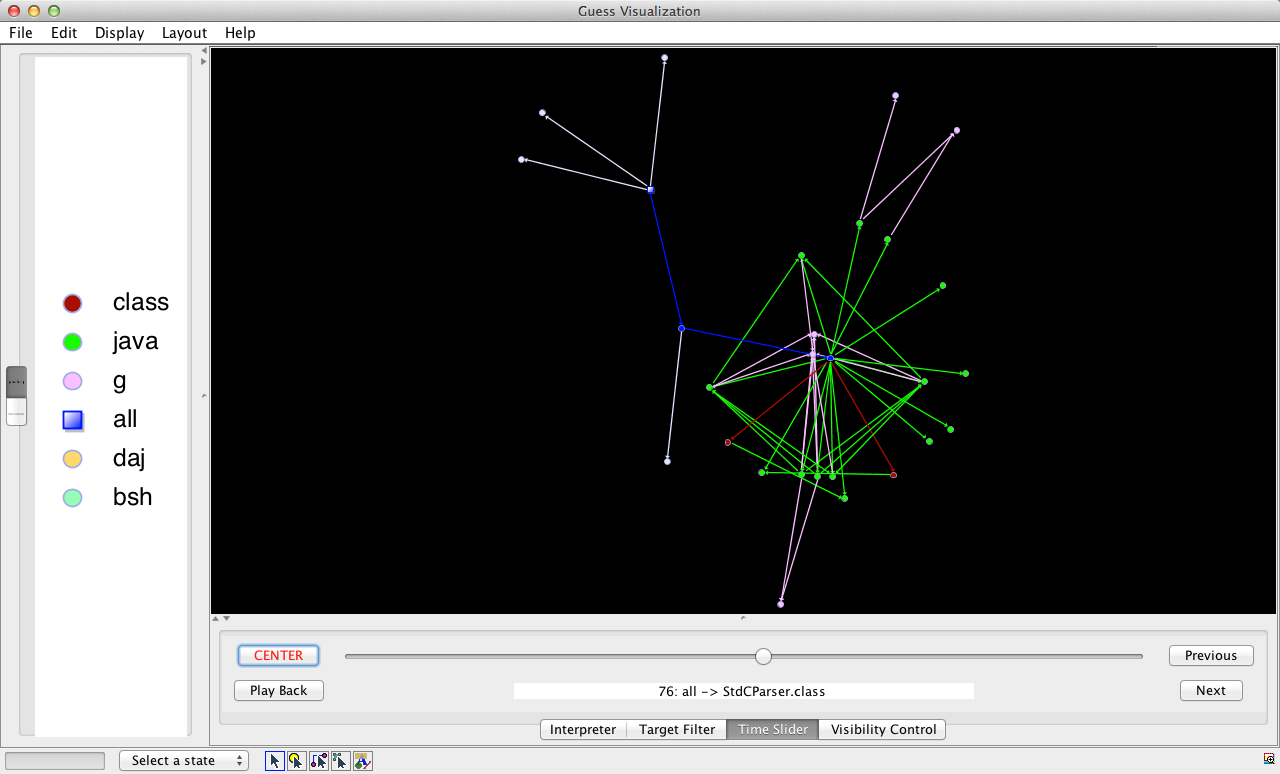
6. Going Back in Time
Wouldn't it be cool to replay a build and see in what order targets are being processed? You're in luck,
since GNU Make's trace file, and hence MAKAO's build dependency graph, records the order in which
dependencies are followed. This is stored in the "tstamp" attribute of a dependency. Targets also have such
an attribute, but since targets can be checked multiple times, only one value (most recent one) is stored.
Dependencies on the other hand are unique, hence their "tstamp" value is reliable.
The time slider on the "Time Slider" tab allows you to scroll across time, while the "Previous" and "Next"
buttons allow finer-grained control. At any point, you can center the screen using the familiar red "CENTER"
button. The name of the most recently executed build dependency is shown at the bottom of the screen
(initially, the last executed build target is shown).
As an experimental feature, you can see an automated replay of the whole build by clicking on the "Play Back"
button. You will get a warning that the replay can *not* be paused, so be careful! To speed up the replay,
all successive dependencies of the same build target are shown at once, which is especially handy in the
case of header dependencies.
You might have noticed that clicking on the "Time Slider" tab can take a while. This is because MAKAO stores
the state of the graph obtained using the filter controls of the previous step, such that when returning to
those tabs the state can be restored. The "Time Slider" tab has its own state of the graph. You can move to
the "Interpreter" tab without losing that state, but as soons as you click on one of the other tabs, their
state is restored (similarly, moving to the "Interpreter" tab from the other tabs keeps their state intact,
allowing manipulation from the "Interpreter", see below).
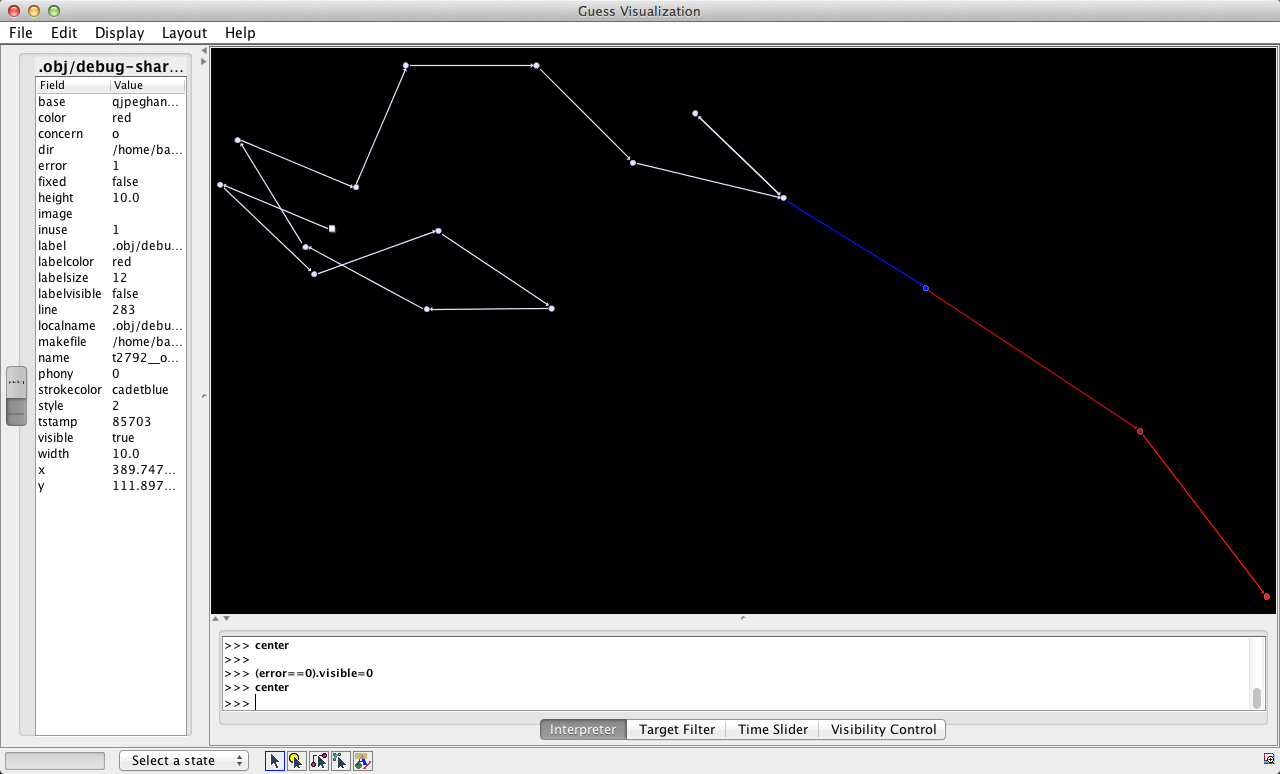
7. Scripting your Analyses
Did you know that all the buttons, sliders and menus used thus far are just Gython extensions on top of GUESS? Gython is a dialect of Jython, which is a version of
Python with access to Java classes and objects, since Jython interpreters are embedded in Java applications.
In other words, each node and dependency in the build dependency graph is a Gython object!
The "name" attribute of a node or edge is the name through which the node or edge can be referenced in the
"Interpreter" tab. For example, a target with as "name" the value "all" can be referenced as
all:
The above code snippet first prints the name of the "all" target, then hides all the build targets that had
no error during the build by setting those targets' "visible" attribute to zero. You should only see the
paths in the build dependency graph along which build errors occurred. The expression between parentheses
selects all nodes (or edges) with a particular attribute value. Finally, line 3 loads in a custom Gython
script, while line 4 programmatically centers back the graph. More on Gython can be found in the GUESS manual.
If you're more a declarative person, you can use the above command instead of the one in step 2 to obtain a
Prolog representation of the build dependency graph. The format is compatible with SWI Prolog, and you can write your own rules and queries in terms
of the provided facts (there is also an XML representation of the commands and active preprocessor macros).
If you want a small framework for systematically identifying certain build targets (based on a query), then
filtering those targets out of the build dependency graph (to simplify it), you can use the following
commands (subsumes the command above):
cp$MAKAO/filtering/prolog-backward/rules/gdf-sample.pl \$SOMEDIR/gdf-trace.pl
cp$MAKAO/filtering/prolog-backward/rules/gdf-sample-logic.pl \$SOMEDIR/gdf-trace-logic.pl
cp$MAKAO/filtering/prolog-backward/bin/prepare_fact_base.sh \$SOMEDIR/prepare_fact_base.sh
#Modify the first three variable definitions of#<code>$SOMEDIR/prepare_fact_base.sh</code> and make sure#that <code>PL_IN=$WORK_DIR/trace-facts.pl</code>$SOMEDIR/prepare_fact_base.sh
#modify and add rules, see below#apply the rules to filter the graph, like this:$MAKAO/filtering/prolog-backward/bin/show_reduced.sh \
trace-facts.pl target_name
#layout the graph as usual, then visualize using:$MAKAO/filtering/prolog-backward/ui/show.sh some_file-piccolo.gdf \
target_name
With the sample rules as inspiration, you can write logic filtering rules in
$SOMEDIR/gdf-trace-logic.pl and configure which rules are active in
$SOMEDIR/gdf-trace.pl. This part of MAKAO is quite advanced and experimental, details are given
in my PhD dissertation), but feel free to
contact
in case of trouble.
Shane McIntosh, Bram Adams, Yasutaka Kamei, Thanh H. D. Nguyen and Ahmed E. Hassan (2011). An Empirical Study of Build Maintenance Effort, in Proceedings of the 33rd International Conference on Software Engineering (ICSE) (Waikiki, Honolulu, Hawaii), p. 141-150. (Acceptance ratio: 62/441=14%) (mentioned here, here, here and here)
Shane McIntosh, Bram Adams and Ahmed E. Hassan (2010). The Evolution of ANT Build Systems, in Proceedings of the 7th Working Conference on Mining Software Repositories (MSR) (Cape Town, South Africa), p. 42-51, IEEE. (Acceptance ratio: 16/51=31.4%) (invited for special issue)
Bram Adams, Kris De Schutter, Herman Tromp and Wolfgang De Meuter (2008). The Evolution of the Linux Build System, in Proceedings of the ERCIM Working Group on Software Evolution 2007 , Electronic Communications of the ECEASST (Paris, France), 8, p. 16 p..
Bram Adams, Kris De Schutter, Herman Tromp and Wolfgang De Meuter (2007). Design Recovery and Maintenance of Build Systems, in Proceedings of the 23rd International Conference on Software Maintenance (ICSM) (Paris, France), p. 114-123, IEEE. (Acceptance ratio: 46/214=21%) (invited for special issue)
Bram Adams, Kris De Schutter, Herman Tromp and Wolfgang De Meuter (2007). MAKAO [demo], in Proceedings of the 23rd International Conference on Software Maintenance (ICSM) (Paris, France), p. 517-518, IEEE.